Trips report running too slow


If you don't see any queries, it probably means that slowdown is unrelated to the database.
The query should show up at some point if the report is successfully generated, right?
I am running the SHOW PROCESSLIST; every second an it never comes up.
Depends on the query. If it finishes in milliseconds, you might easily miss it.
You are probably right. I finally got the query from the general log and the issue doesn't seem to be with mysql.
The problem is: Generating trips report for past week (7 days) take more than 1 min.
This is the query returning 5106 rows:SELECT * FROM tc_positions WHERE deviceId = 15 AND fixTime BETWEEN '2025-03-01 22:00:00' AND '2025-03-08 21:59:59.999' ORDER BY fixTime
Running this query directly in mysql takes 0.2882 seconds.
So my assumption is that processing those 5106 rows by traccar server takes the remaining time, which is not something we can disregard.
If I am correct, what can be done to speed up the report creation server side?
For the record, the server I am testing with has 4 GB RAM, 2 vCPUs and 80 GB SSD. MySQL database is running on it's separate container so it doesn't add any load on the server by itself.
UPDATE: Running the same query for an entire month, I get an error:
The proxy server received an invalid response from an upstream server.The proxy server could not handle the request. Reason: Error reading from remote server.
The query when run directly in mysql, returns 23437 rows. Query takes 0.2237 seconds.
SELECT * FROM tc_positions WHERE deviceId = 15 AND fixTime BETWEEN '2025-01-31 22:00:00' AND '2025-02-28 21:59:59.999' ORDER BY fixTime.

I don't know if it helps you but when I had to optimize the reports I reviewed this https://www.h3xed.com/web-development/php-and-apache-504-gateway-timeout-troubleshooting-and-solutions
Thanks for sending the resource!
From those settings, on the default traccar installation, only the Apache timeout will be applicable. Mine is 100. What value did you use for yours?
Still, the apache timeout will only provide larger window for the report script to generate results. Unfortunately, it won't speed up the slow report generation which is the issue at hand. 1 minute or more for a week worth of data is too much in terms of user friendly feature.
Are you using Excel report? It's known to be slow.
There is no difference in the performance between Show and Export actions. It takes the same time.
At the end the Trips report contain only 50 rows.
What is causing the slowness, I believe, is the loop trough all the database records looking for the start and end trip position records.
This got me thinking, if we reduce the database records, performance will improve.
A way to reduce the database records would be to exclude consecutive positions where the speed is greater than 0. In those instances we will have motion = true every time, so there is no need to check for motion.
An oversimplified approach would be:
Row 1, no motion. Include.
Row 2, motion. Include.
Row 3, motion. Do not include.
Row 4, motion. Do not include.
Row 5, motion. Do not include.
Row 6, no motion. Include.
So we still have the records and timestamps when motion value changes, we just exclude the positions where motion is true for hundreds of consecutive records.
What do you think, would something like this work?
Going through 5k rows should be almost instant. I think your assumption about the root cause is completely wrong.
That could be. My assumption is based on the exclusion method:
- Mysql Request takes less than 0.3 seconds
- The server CPU load does not increase more than 15% (and only for couple of seconds) during the report fetching. That is a server with two CPUs and 4GM of RAM
- The request takes the same amount of time via the official Web API (both Report Show and Export), when run in browser as URL, when called trough Postman and when requested via a different custom API.
That leaves a slow script execution. If it's not that, what else could be the root cause?
So, I put some timers inside the slowTripsAndStops function in ReportUtils.java and here are the results for fetching 2513 positions for 2 days:
2025-03-20 10:41:57  WARN: Get Positions Duration:1101 ms
2025-03-20 10:42:29  WARN: Loop Duration:31123 ms
2025-03-20 10:42:31  WARN: Slow report duration:34221 ms
Here is the screenshot from the browser: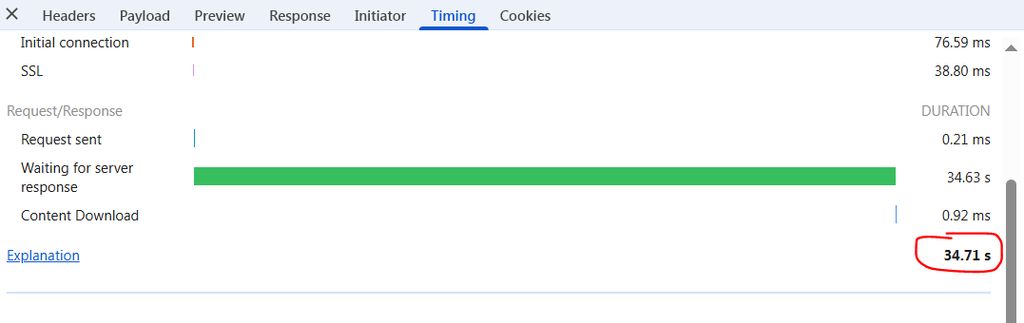
You can see the that for loop going trough 2513 records to determine the motion takes about 30 seconds, which ultimately is the reason for the slow report generation.
For comparison, exporting those same 2513 positions in a Route Report takes about 7 seconds.
Below is the code with the timers in the `ReportUtils.java ( my edits begin at the very start of the relevant lines):
    public <T extends BaseReportItem> List<T> slowTripsAndStops(
            Device device, Date from, Date to, Class<T> reportClass) throws StorageException {

long startTime = System.nanoTime(); // Start time

        List<T> result = new ArrayList<>();
        TripsConfig tripsConfig = new TripsConfig(
                new AttributeUtil.StorageProvider(config, storage, permissionsService, device));
        boolean ignoreOdometer = config.getBoolean(Keys.REPORT_IGNORE_ODOMETER);

long getPositionsTimeStart = System.nanoTime(); // Start time
        var positions = PositionUtil.getPositions(storage, device.getId(), from, to);
long getPositionsTimeEnd = System.nanoTime(); // End time
long getPositionsDuration = (getPositionsTimeEnd - getPositionsTimeStart) / 1_000_000;
LOGGER.warn("Get Positions Duration:" + getPositionsDuration + " ms", "error0");

        if (!positions.isEmpty()) {
            boolean trips = reportClass.equals(TripReportItem.class);

            MotionState motionState = new MotionState();
            boolean initialValue = isMoving(positions, 0, tripsConfig);
            motionState.setMotionStreak(initialValue);
            motionState.setMotionState(initialValue);

            boolean detected = trips == motionState.getMotionState();
            double maxSpeed = 0;
            int startEventIndex = detected ? 0 : -1;
            int startNoEventIndex = -1;
long loopTimeStart = System.nanoTime(); // Start time
            for (int i = 0; i < positions.size(); i++) {
                boolean motion = isMoving(positions, i, tripsConfig);
                if (motionState.getMotionState() != motion) {
                    if (motion == trips) {
                        if (!detected) {
                            startEventIndex = i;
                            maxSpeed = positions.get(i).getSpeed();
                        }
                        startNoEventIndex = -1;
                    } else {
                        startNoEventIndex = i;
                    }
                } else {
                    maxSpeed = Math.max(maxSpeed, positions.get(i).getSpeed());
                }

                MotionProcessor.updateState(motionState, positions.get(i), motion, tripsConfig);
                if (motionState.getEvent() != null) {
                    if (motion == trips) {
                        detected = true;
                        startNoEventIndex = -1;
                    } else if (startEventIndex >= 0 && startNoEventIndex >= 0) {
                        result.add(calculateTripOrStop(
                                device, positions.get(startEventIndex), positions.get(startNoEventIndex),
                                maxSpeed, ignoreOdometer, reportClass));
                        detected = false;
                        startEventIndex = -1;
                        startNoEventIndex = -1;
                    }
                }
            }
long loopTimeEnd = System.nanoTime(); // End time
long loopDuration = (loopTimeEnd - loopTimeStart) / 1_000_000;
LOGGER.warn("Loop Duration:" + loopDuration + " ms", "error0");

            if (detected & startEventIndex >= 0 && startEventIndex < positions.size() - 1) {
                int endIndex = startNoEventIndex >= 0 ? startNoEventIndex : positions.size() - 1;
                result.add(calculateTripOrStop(
                        device, positions.get(startEventIndex), positions.get(endIndex),
                        maxSpeed, ignoreOdometer, reportClass));
            }
        }

long endTime = System.nanoTime(); // End time
long duration = (endTime - startTime) / 1_000_000; // Convert to milliseconds
LOGGER.warn("Slow report duration:" + duration + " ms", "error0");

        return result;
    }
Maybe it's your geocoding provider? Try disabling it.
So it's definitely the geocoding provider. I now use nominatum. Which one do you recommend with faster response rate?
In some forum threads, it is mentioned to check the database query initiated when running a report to try identify the cause of slow report generation.
I am using mysql and
SHOW PROCESSLIST;does not show any queries when the reports are running. How can I see the traccar database query when the reports are executed?